Dashboard
From the dashboard, you will find information of tickets based on their status by selecting From date–To date, and other filters.
From donut chart you will exhibit the number of open vs closed tickets for selected date.
From bar graph, will show the number of tickets status for the selected date.
From line graph, will display the number of tickets created per day for the selected date.
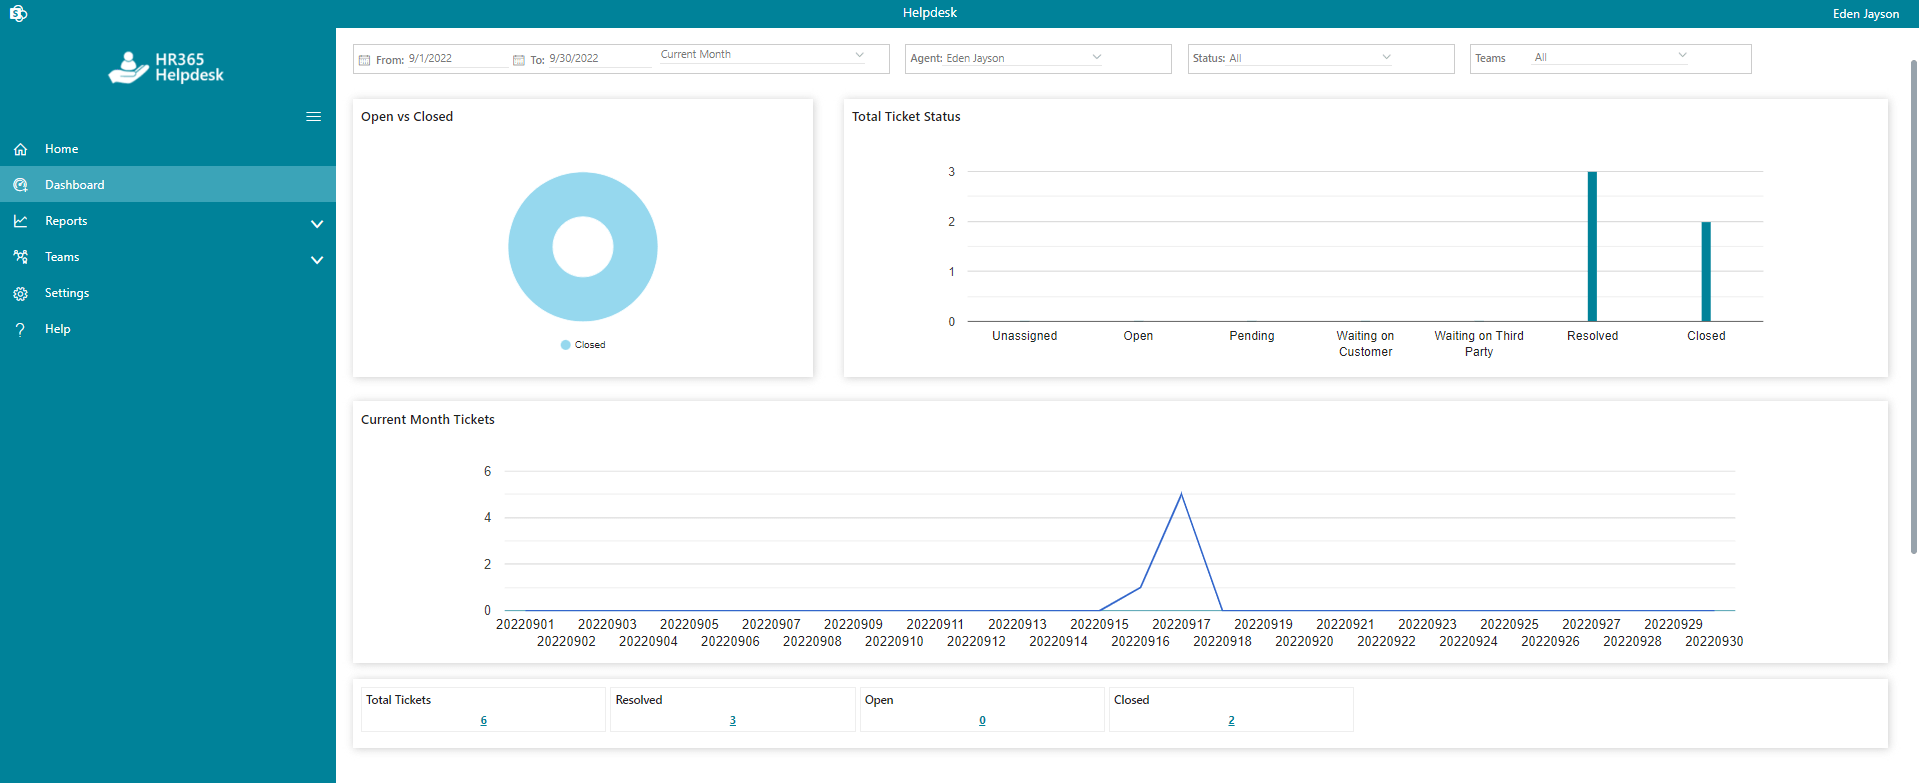
In the dashboard, there is a row of different types of status with number links. If you click on the number links of respective status, a table of tickets will show just below it. You can see the ticket status for different dates or date ranges just by selecting the date from the above date filter. Admin can see tickets of all teams whereas the supervisor can see only his team tickets.
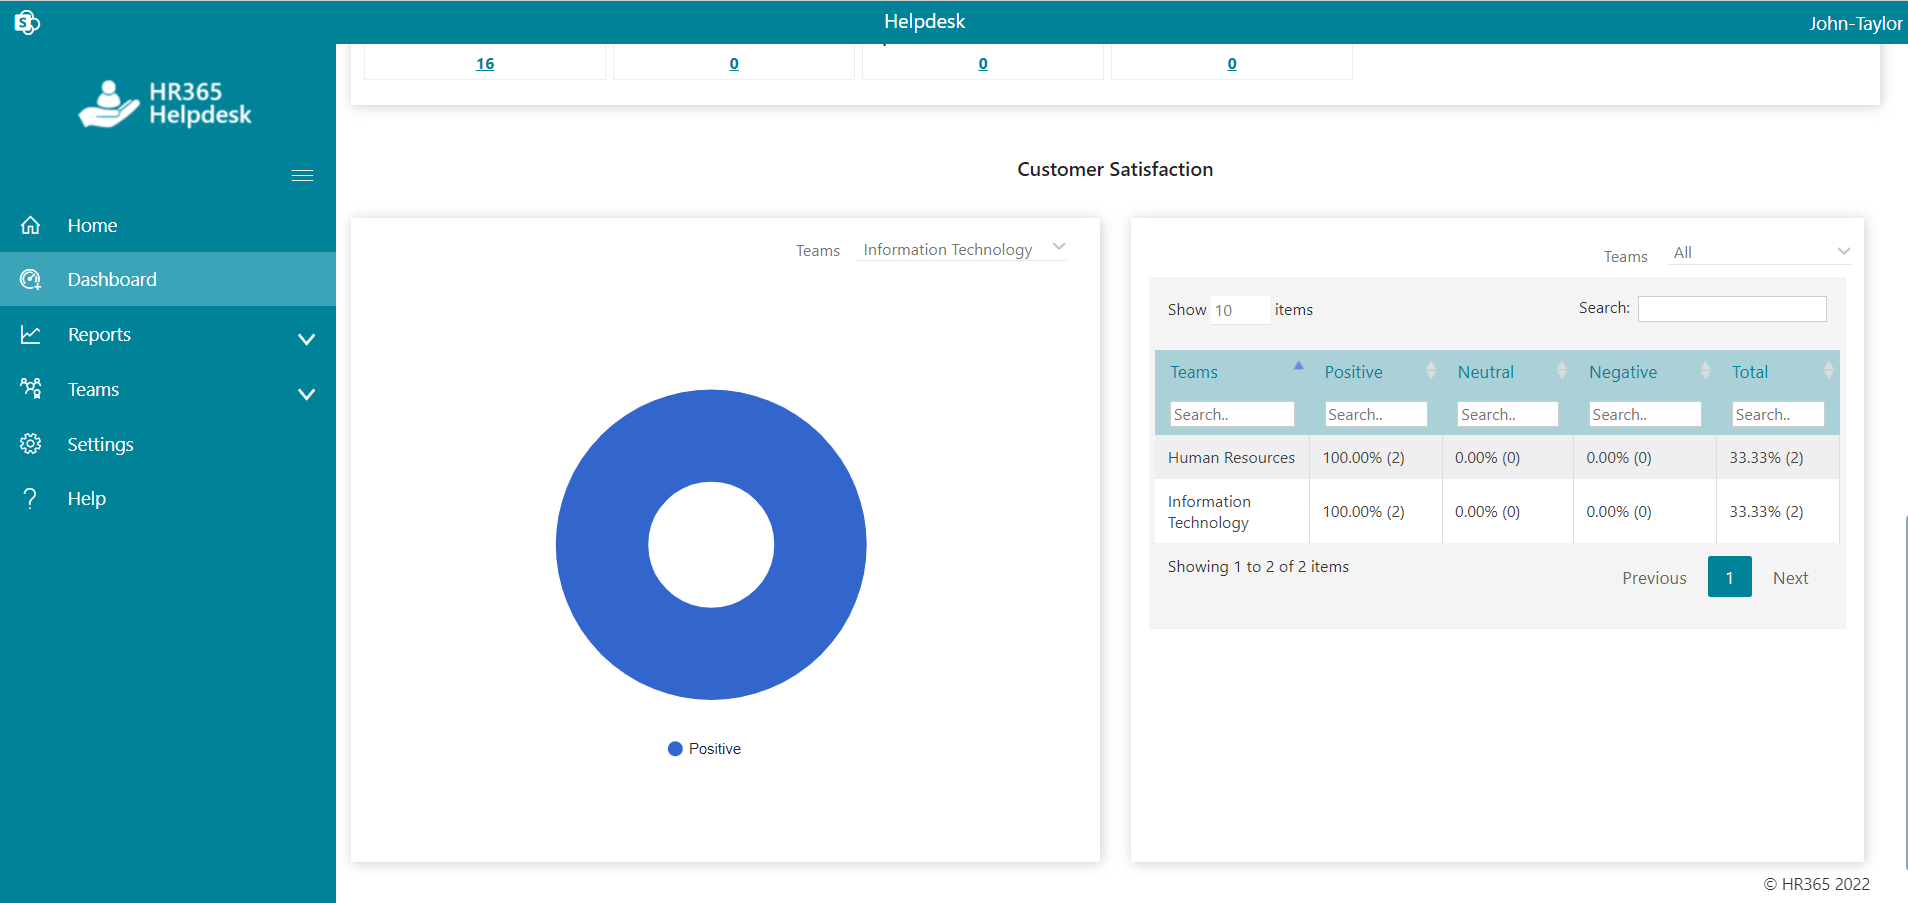
Customer Satisfaction
You can find the information about customer satisfaction in term of percentage for selected dates. You can filter to check for individual teams in both chart and table format.