Dashboard
On the dashboard, you would find information of tickets based on their Status, Departments, Priority Type, Request Type, Survey.
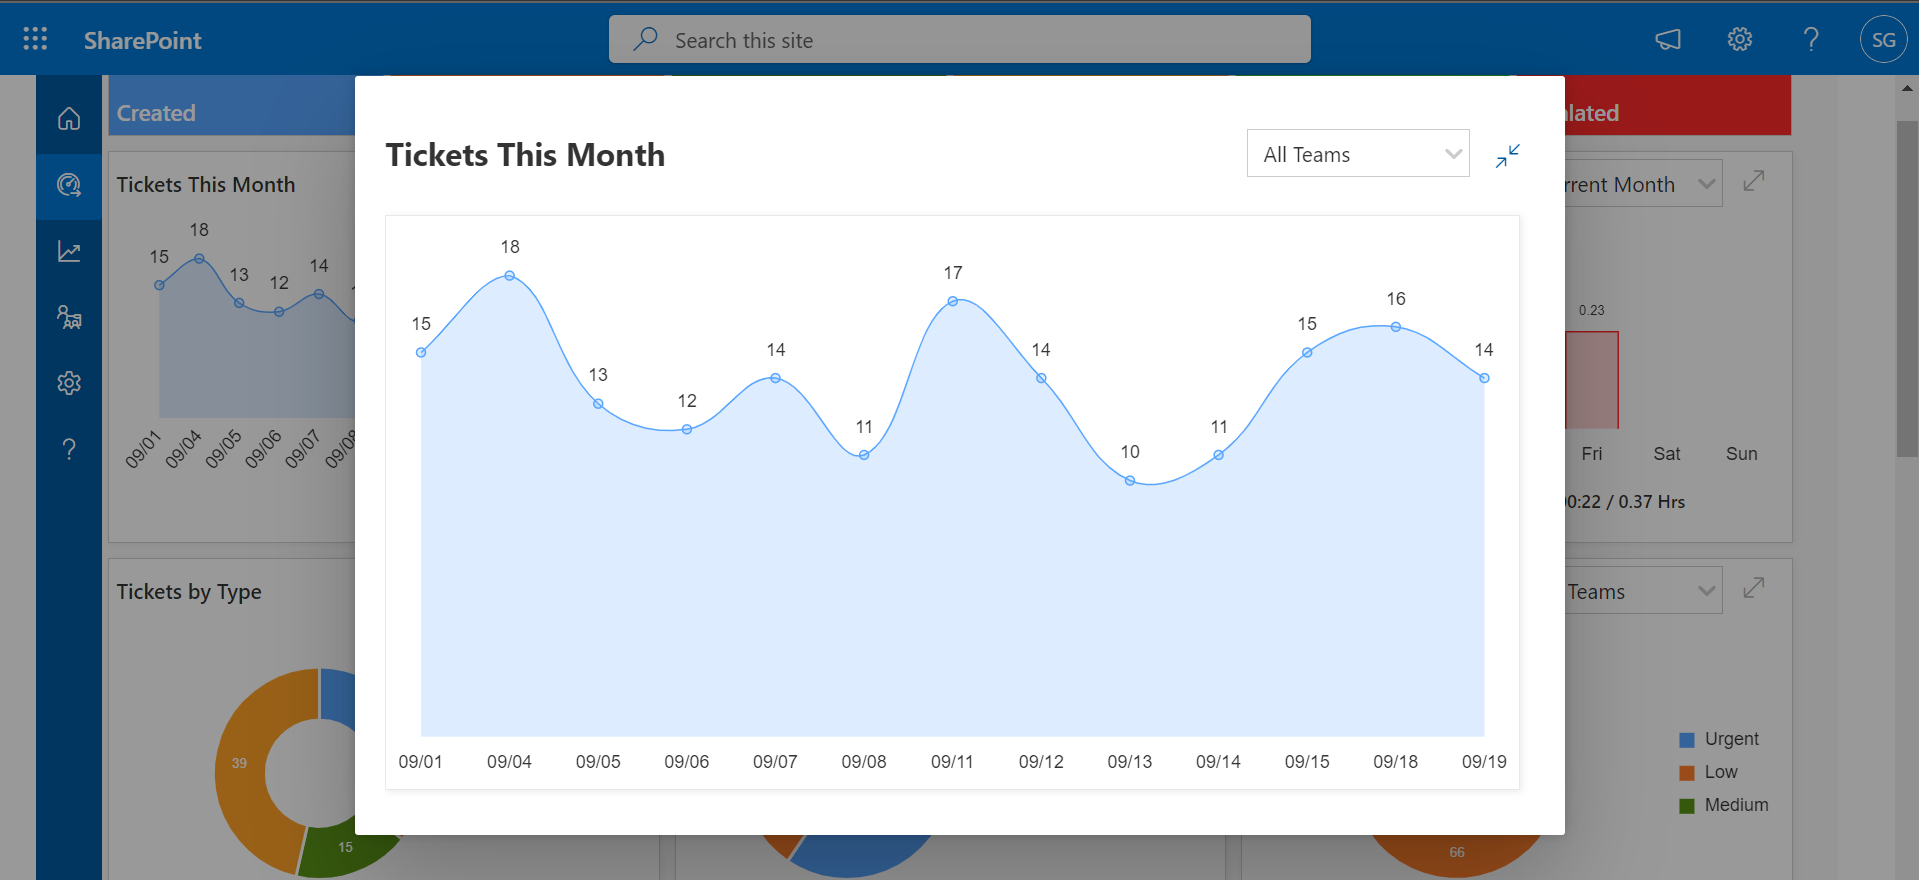
First line chart would exhibit the number of open tickets for the current month, which can be filter on the basis of teams.
Second line chart, would display the averge time of SLA Response in selected time frame or date.
Thirt Bar chart, would display the weekly averge time of SLA Response in selected time frame or date.
Below Donught charts, would display the number of tickets created by Request Type, Departments and Priority Type.
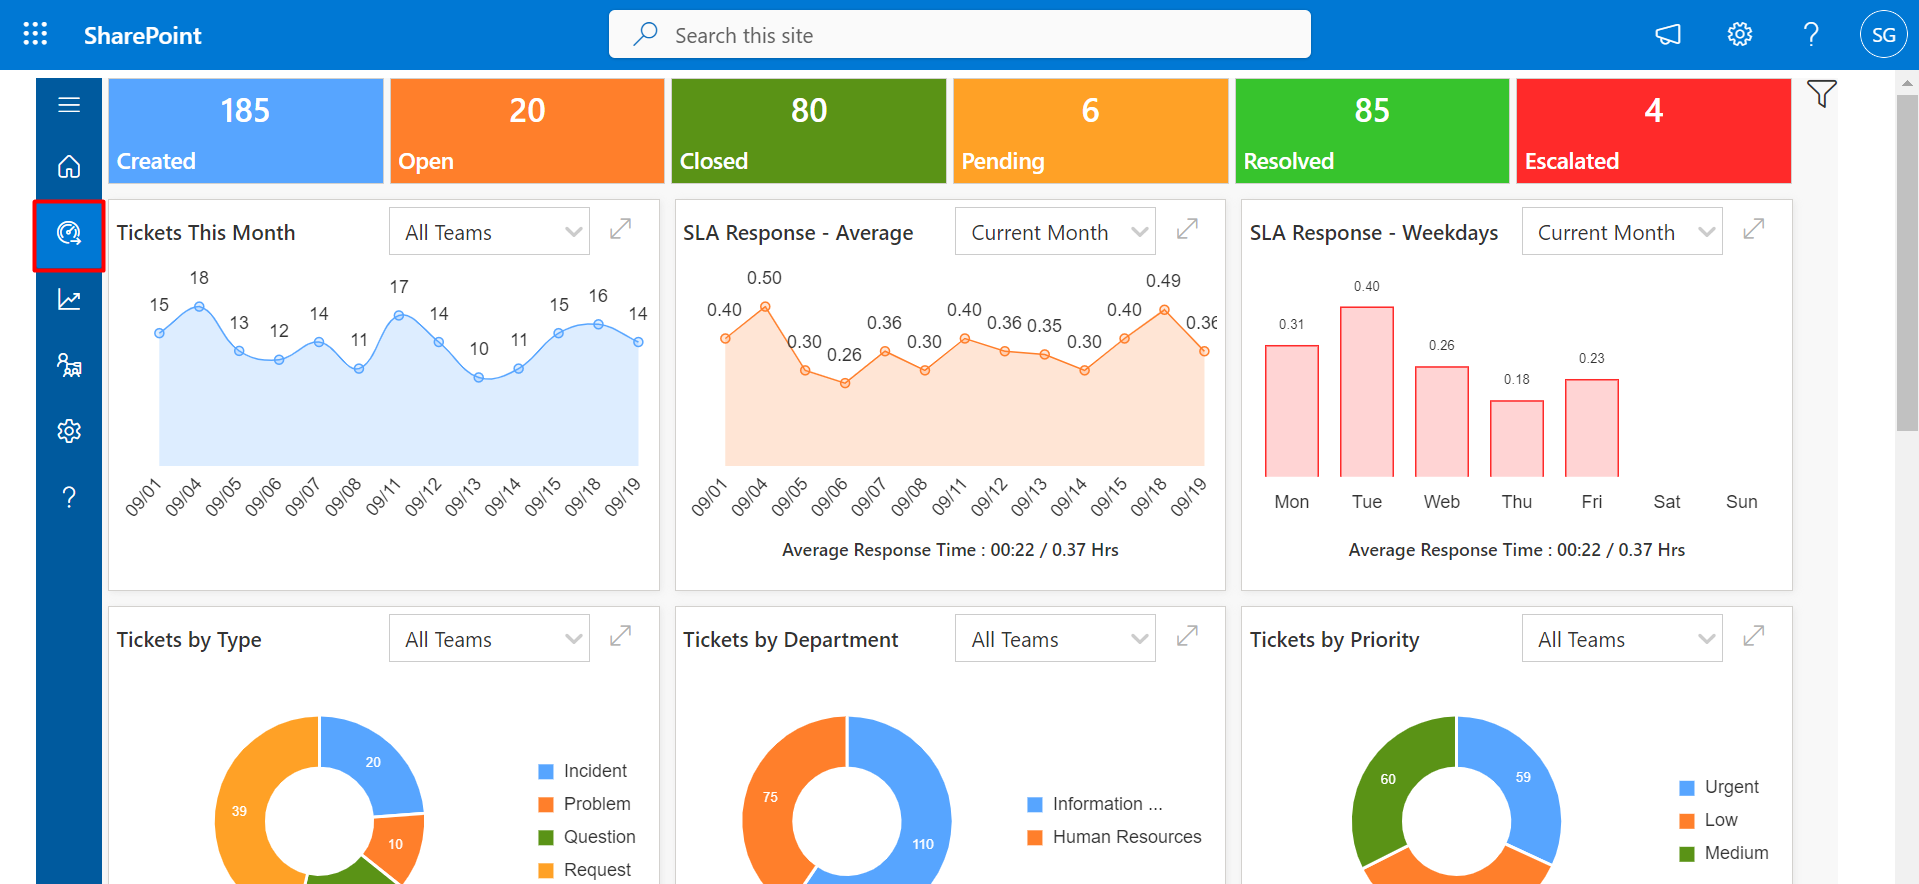
User can also expand the chart with the help this expand icon
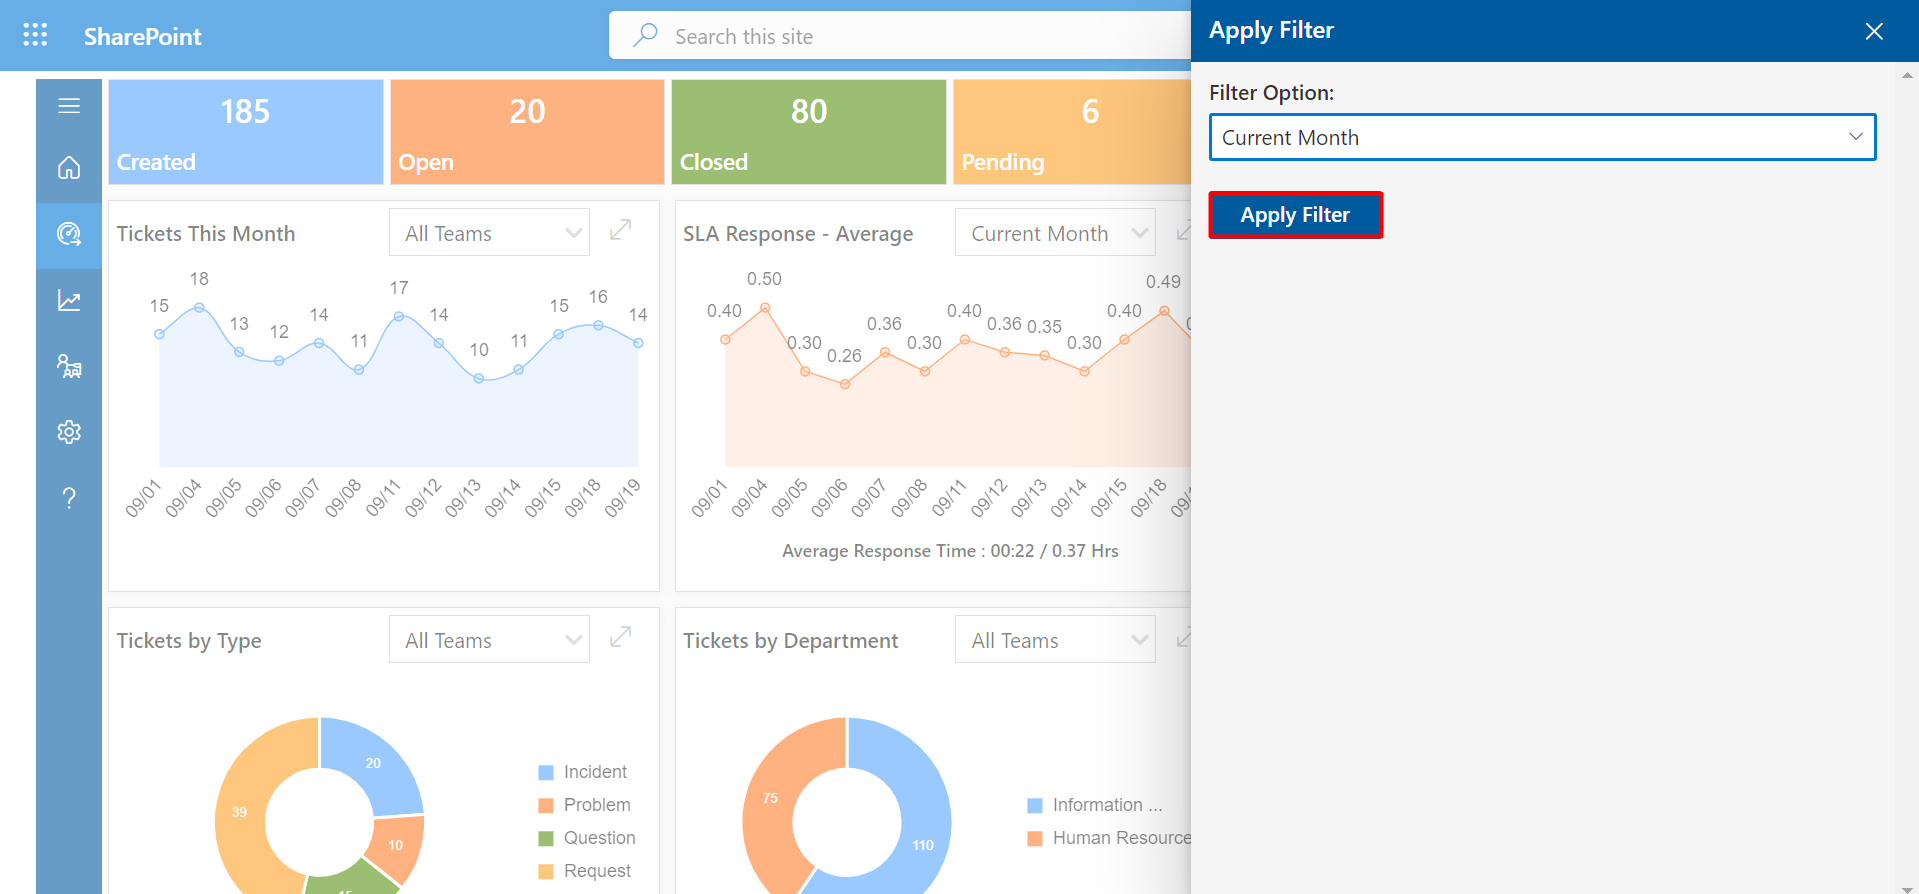
User can filter the Dashboard data globally with the help of this globally filter icon
Select the dropdown option and click on Apply Filter button.
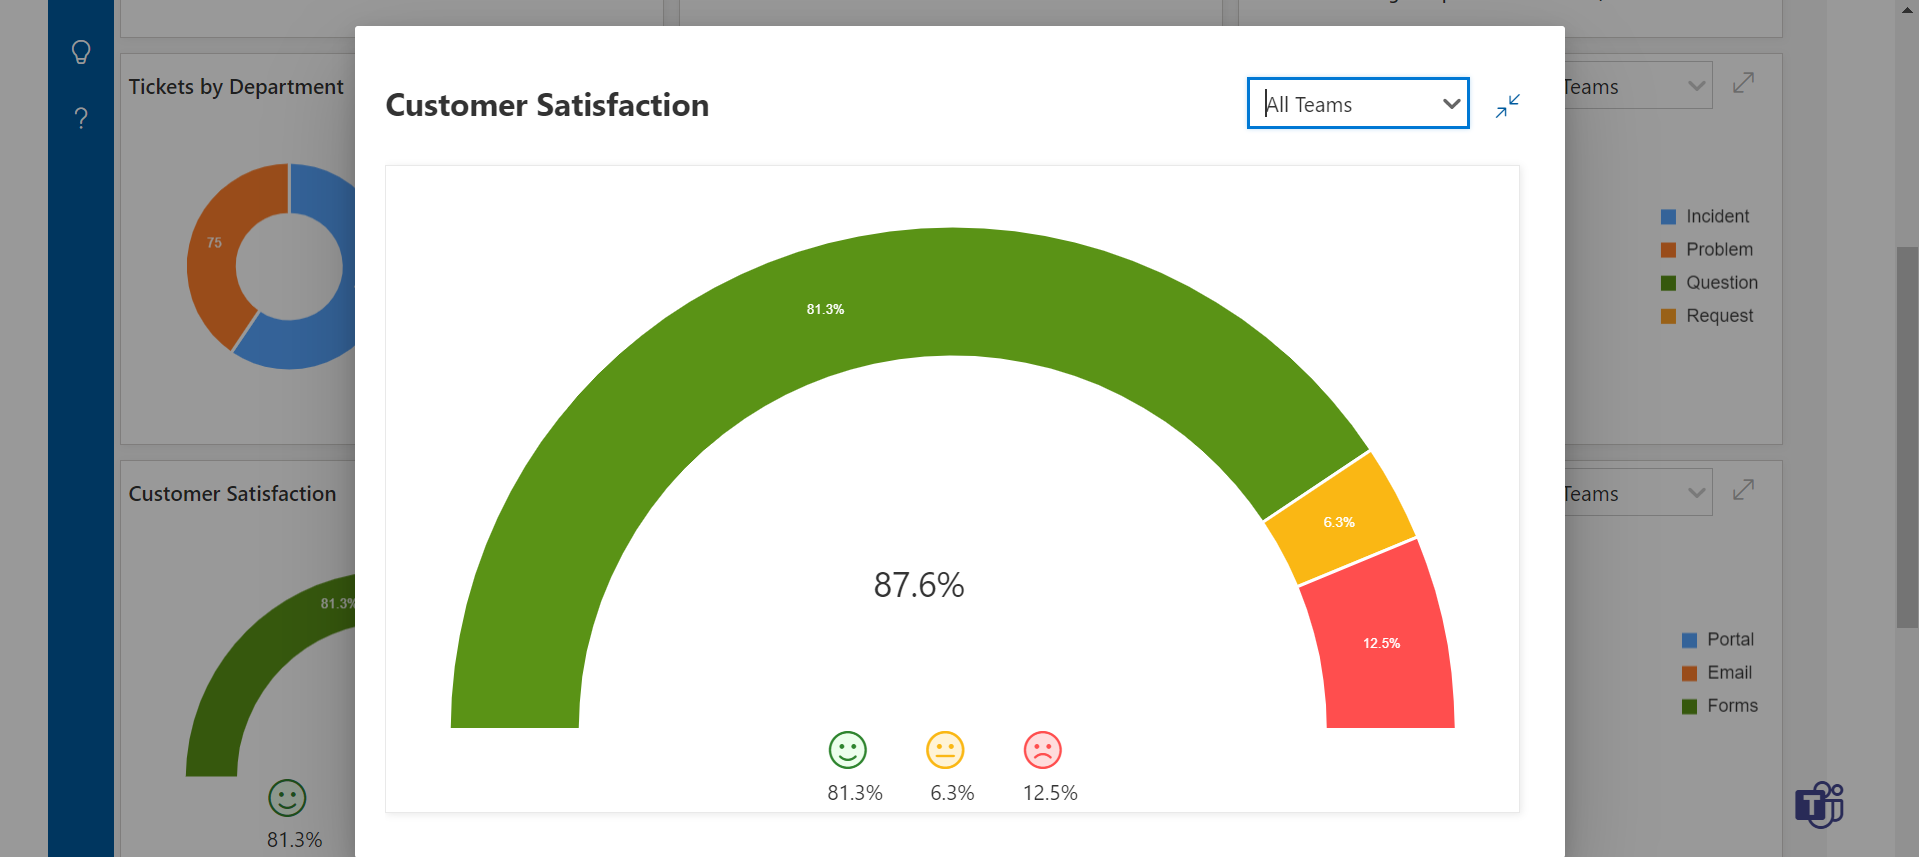
Customer Satisfaction
You could find the information about customer satisfaction in term of percentage for selected dates. You can filter to check for individual teams in both chart and table format.