- Headcount of total user (how many user we have).
- We are calculating of EmployeeType from all users. (only Full Time).
- Calculating avg gender Male or Female by Yrs .
- Calculate the avg age of total users by Yrs.
- Calculate avg from DOJ to current time so how many yrs user existing.
Dashboard
The purpose of a dashboard in an employee directory is to provide a centralized and easily accessible interface that offers a visual overview of various important information and functionalities related to employees within an organization.
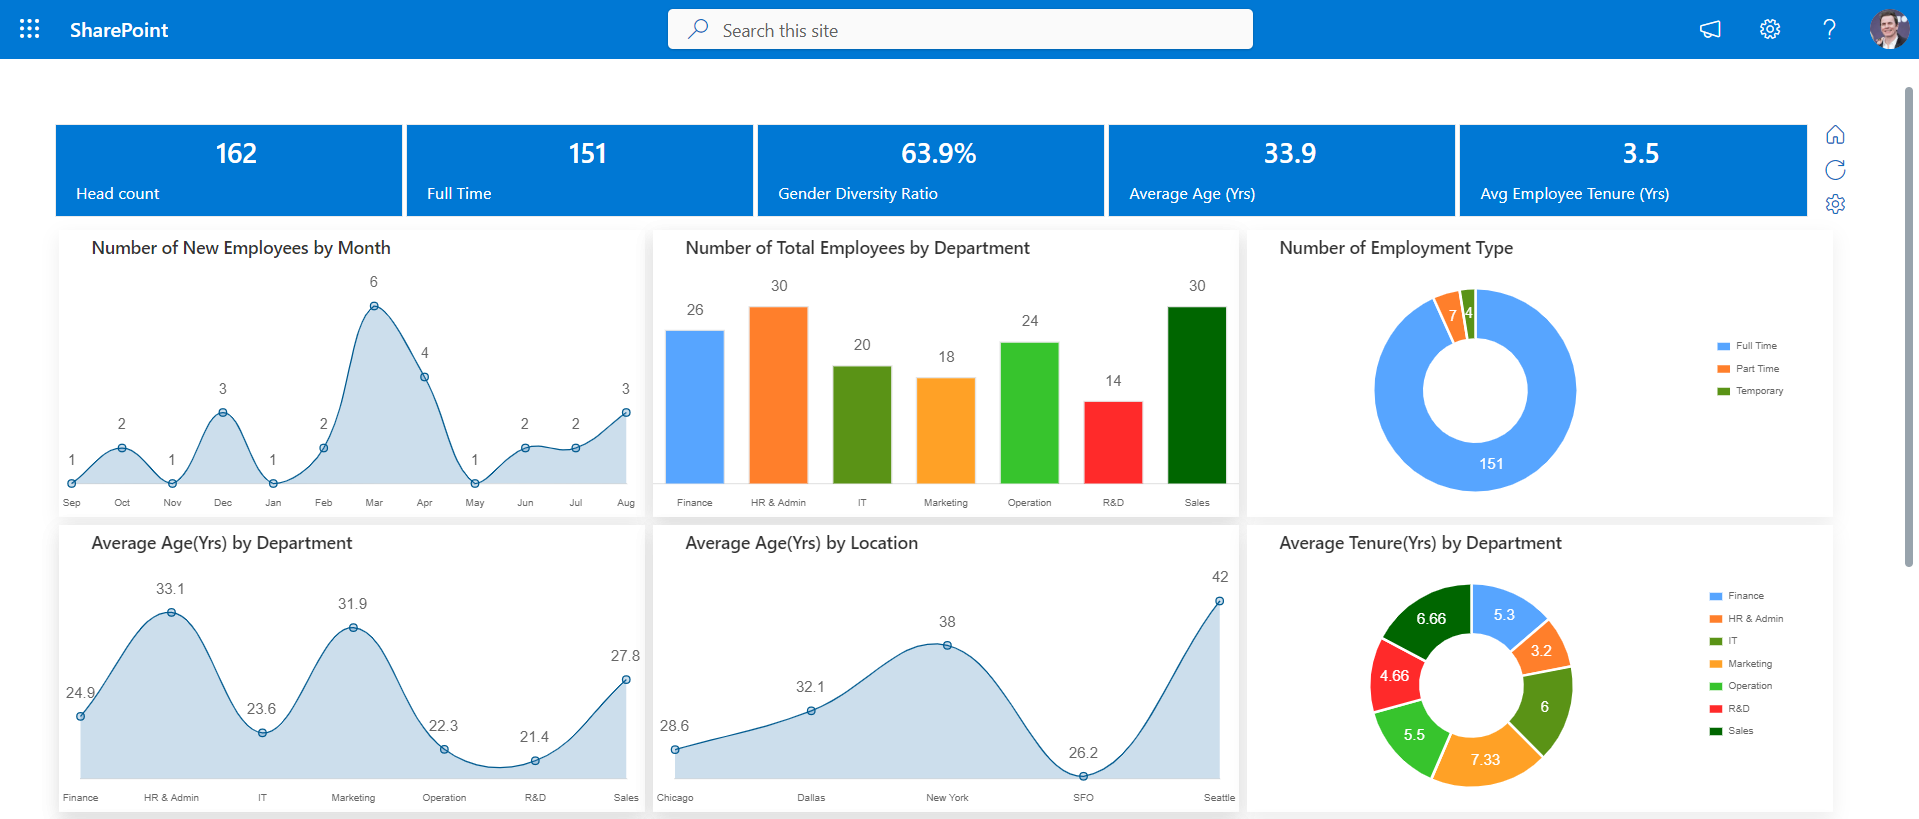
Number of New Employees by Month:
This Graph showcases the monthly count of new employee registrations within the current year.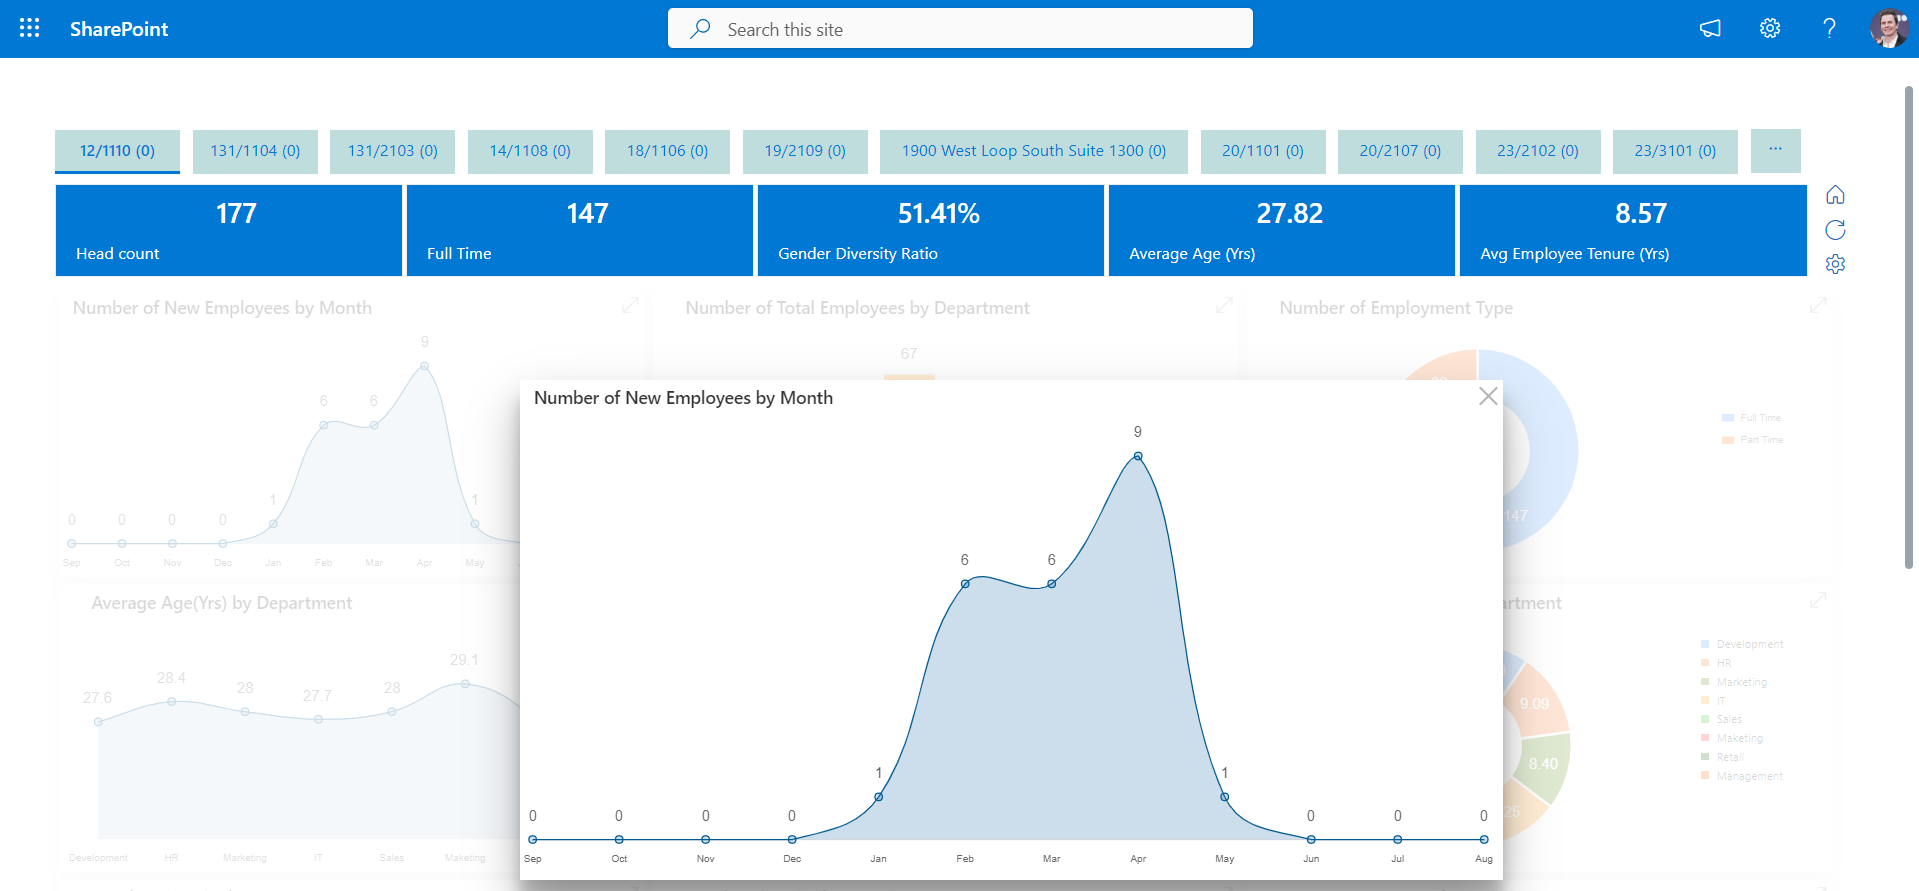
Number of Total Employees by Department:
This presentation displays the employee distribution across different departments. If a user is not assigned to any department, they will not be included in the count.
Number of Employment Type:
In this context, we are tallying the number of users for each employment classification, such as Full Time or Part Time, based on the total user count..
Average Age(Yrs) by Department:
In this scenario, we are presenting the average age of employees within each department. For instance, if there are 10 users in the IT Department, we calculate their average age and apply the same approach to the other departments.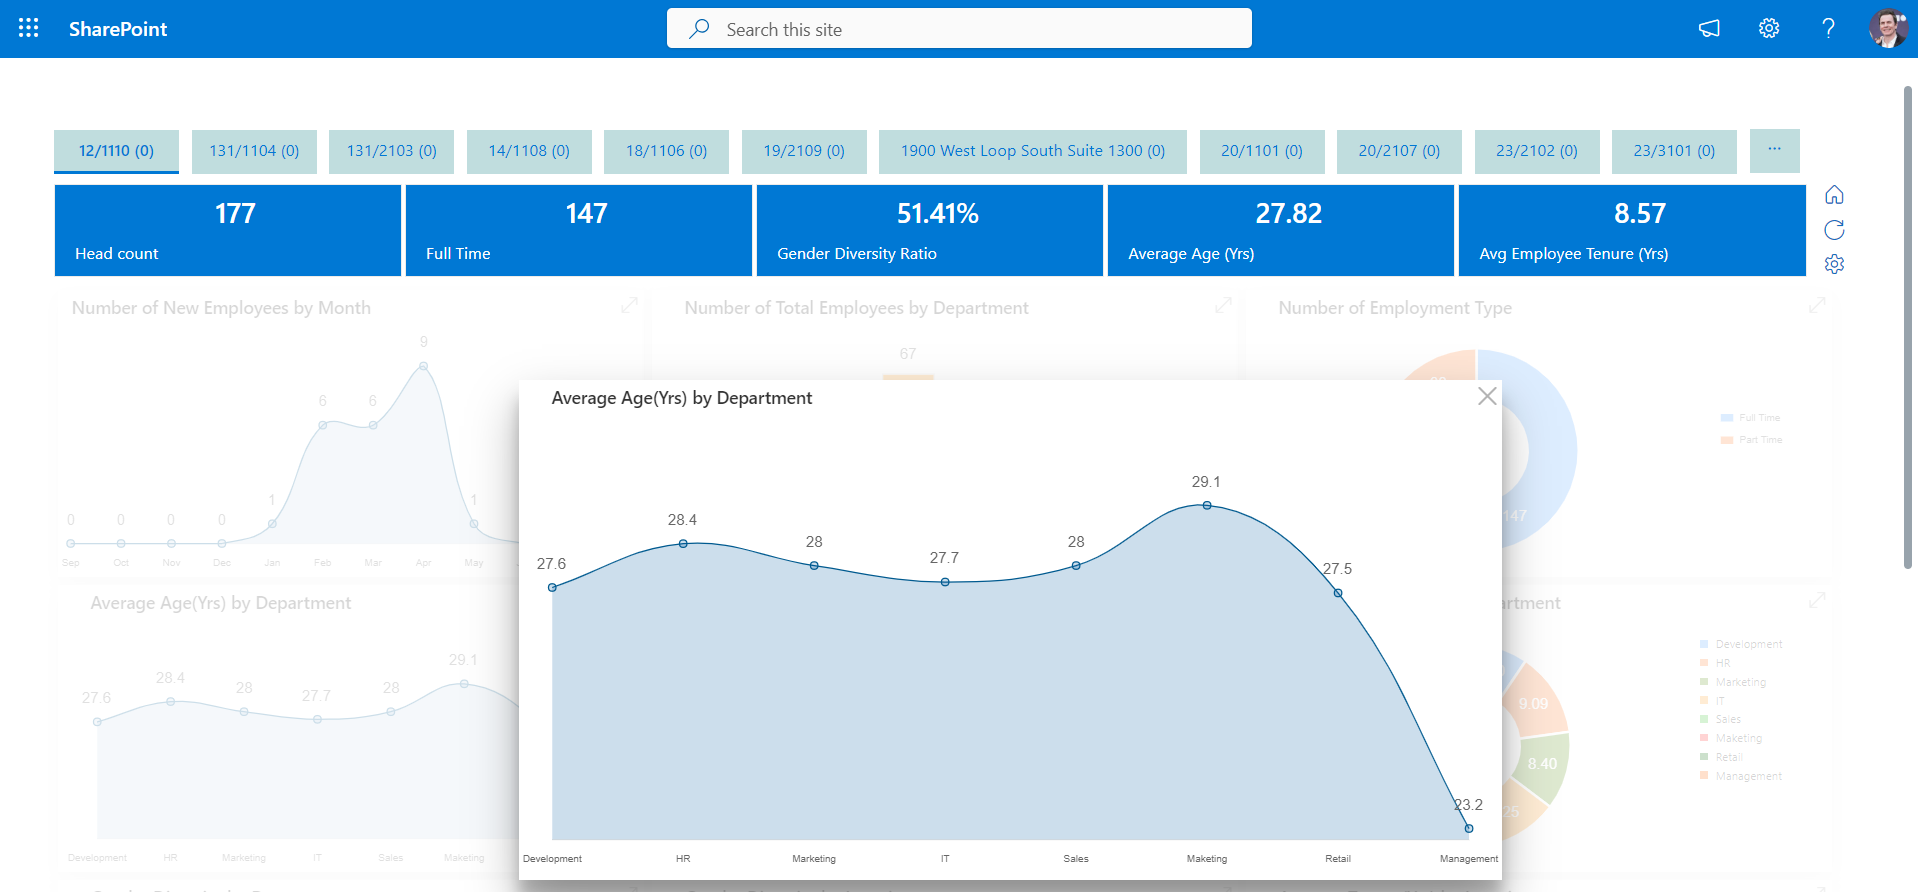
Average Age(Yrs) by Location:
Similarly, we are displaying the average age of employees categorized by their respective locations. For instance, if there is a group of employees in a specific location, we calculate their average age and extend this methodology to other locations as well
Average Tenure by(Yrs) Department:
In this context, we are determining the average tenure of employees within each department. This involves calculating the average duration from the date of joining (DOJ) to the current time..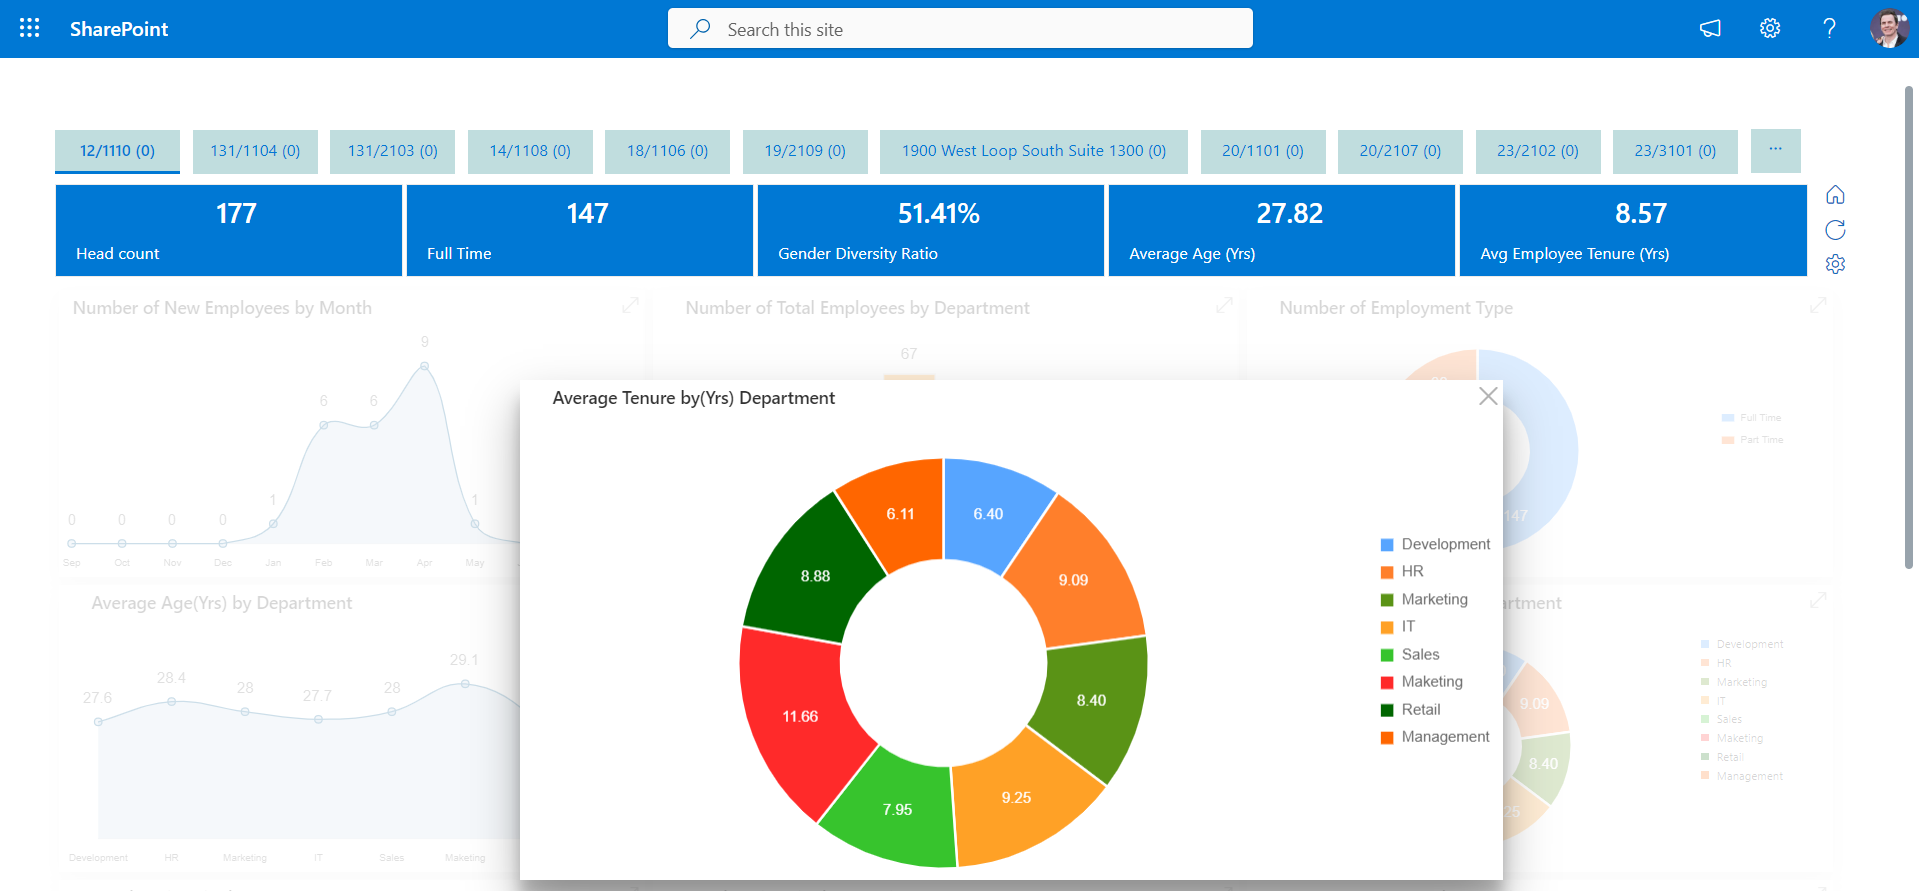
Gender Diversity by Department:
In this analysis, we are obtaining the gender diversity within each department and presenting it as a percentage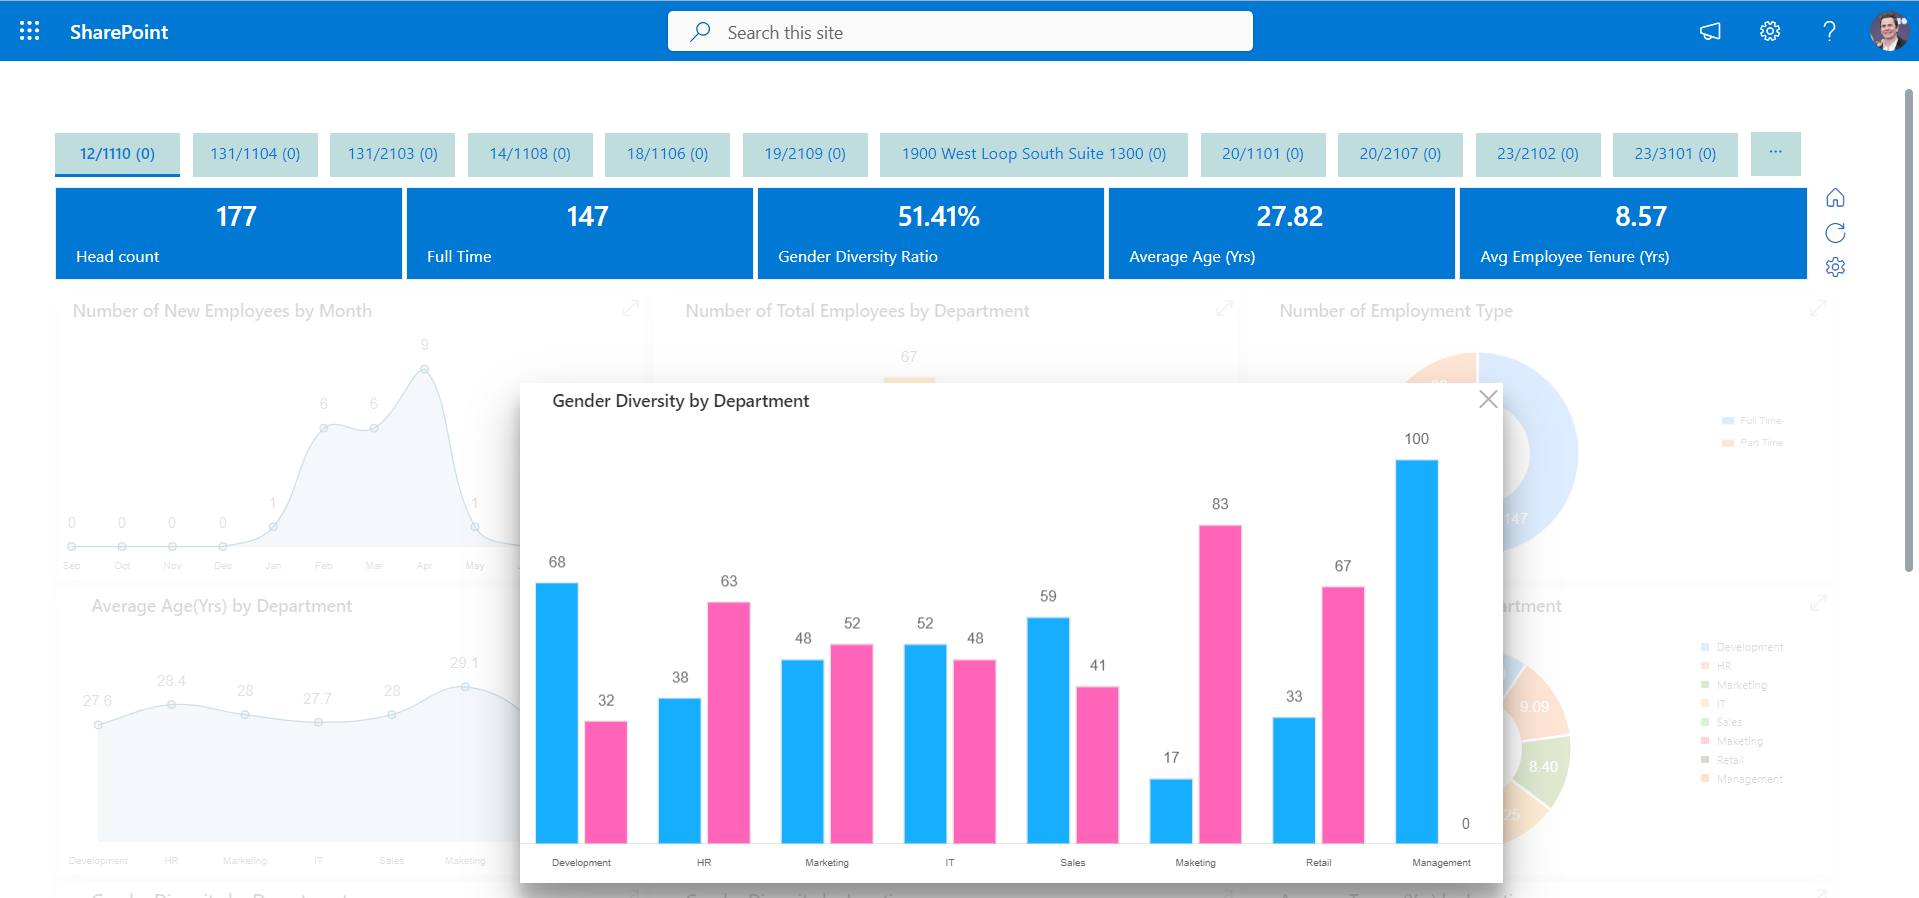
Gender Diversity by Location:
We can view gender diversity by location in this table as per percentage.
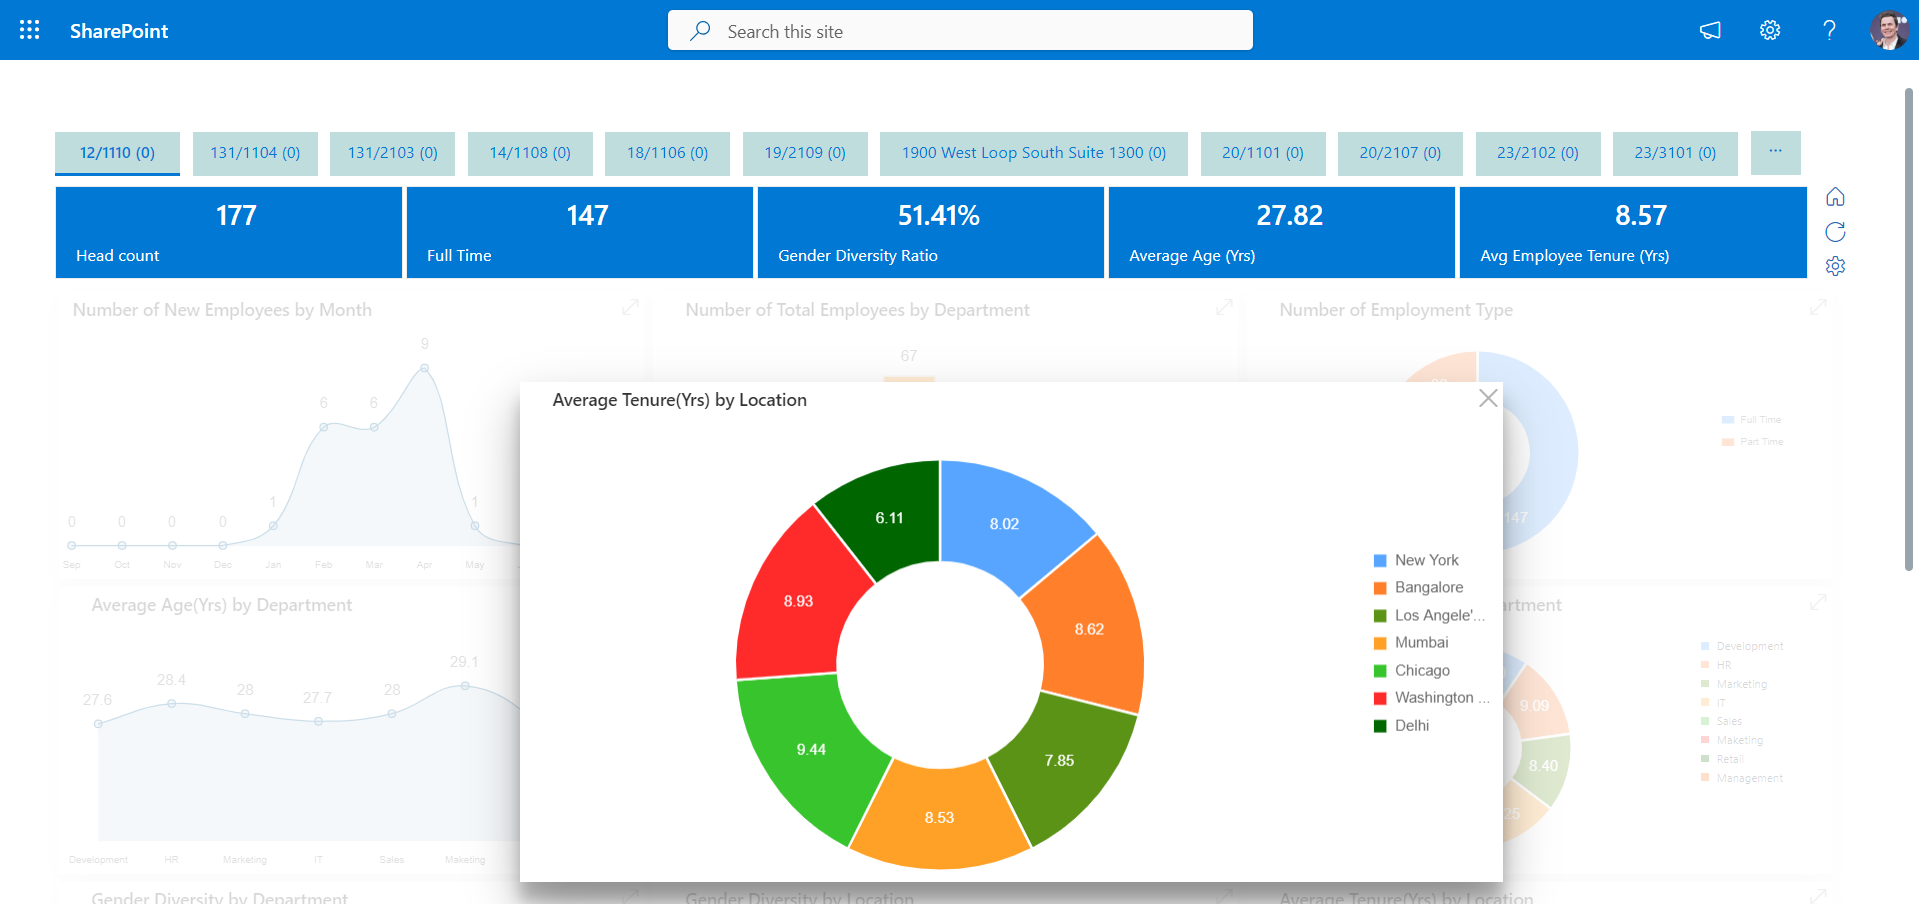
Average Tenure(Yrs) by Location
In this scenario, we are computing the average tenure of employees based on their location. For instance, if there are 10 users in a specific location, we calculate the duration between their date of joining (DOJ) and the current time to determine their individual tenure. Then, we calculate the average tenure for that location. This process is repeated for other locations as well.